Reports
From this place, you can have a birds eye look over the shop performance. You can see a whole lot of reports like:
- Sales by Months
- Conversion Rate
- Top Selling Items
- Top Gross Sale Items
- Top Customers
- Returning Customers
- Abandoned Carts
- Average Order Value
- Top Selling Categories
- Top Suppliers and more
with detail insights. KPI to give you a quick view of how you are doing.
REPORTS PERFORMANCE
KPI
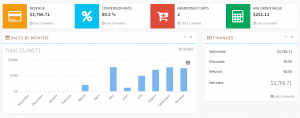 The key performance indicator will show you the sales report for the past 12 months and the financial overview of the year. You can see the conversion rate, total revenue earned in the past 12 months, the total number of abandoned carts and average order value etc.
Top Selling Items
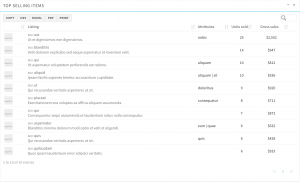 In this section, you’ll see the top 10 items in your inventories with detail variations. This table will show you how many units sold and how much revenue you got from the items. This will help you to set your marketing strategy and add inventory.
Top Customers
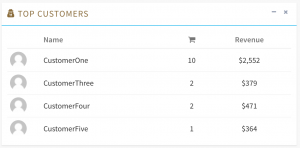 The list of customers who spend much money on your store. This list can help you with the marketing and you can offer discounts for this customers to convert the customer to a returning buyer.
Returning Customers
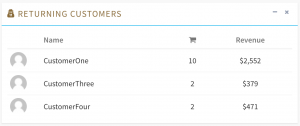 The list of customers who buy from your store frequently. Returning customers are more important than anything because you don’t need to do any marketing to get customers. You can offer discounts for this customers to make them happy.
Top Categories
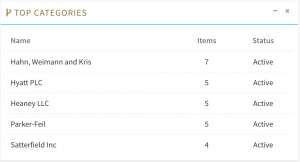 The list of your best performance categories and the number of listings you have on your store. This will help a lot to get the idea of the trend and get more items in this types.
Top Suppliers
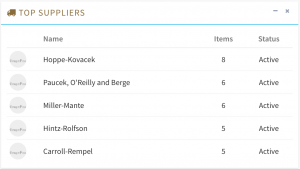 The list of your inventory suppliers and the number of items you have on your store from that supplier.
More reports are coming soon.